B2B Client Life Cycle (Path)
Eventually, a stranger becomes our client. He then becomes a repeat client: he visits the shop frequently and buys various things. And we still don't have any idea why!
Elementary but powerful analytics can help. At least, it can help those who collect data. Today, we are talking about a B2B company. Key Account Managers (KAMs) sense well what their clients need. Or believe they know this. This gut feeling gives the Sales Department significant power within a company.
Companies rarely do a deep dive into client attributes. One reason is that the client study falls somewhere between the finance, marketing and sales departments. These teams usually see the world from different angles. Another, perhaps stronger, reason to avoid such research is the data quality.
Let's try to analyse. Our question for today's ad hoc study: What is the client's path through our products? Let's decompose and formalise this. What is the most frequent first product (category) bought by a new client? What is the next one? And what is the lag between them, and what is the churn? Then, what about the third, fourth, and so on?
Essentially, for this analysis, we need only one database: a list of all clients + products they bought. This database is usually obtained from the Finance Department, which provides the most precise data.
However, it's not enough; the devil is in the details.
Product hierarchy
You have to enrich product codes with meaningful classification. First, you must distinguish between the product (thing), the warranty, the service, and the subscription. Then, every product must be linked to a hierarchy of categories; otherwise, your analysis will go nowhere.
Client identification
Another issue you'll soon discover after the start of analysis: client IDs. There are numerous situations when the client ID and the end-user entity differ. Generally speaking, one client (as the general public sees it, let's say Citibank) has multiple IDs - for various departments, regional offices and country branches. In some cases, the branch has a completely different name, but the purchase policy for "your product" is managed centrally through Citibank Procurement. In other cases, multiple clients can obtain one ID in our SAP: if your distributor manages software for multiple clients, for example.
Therefore, databases require massive pre-processing. To do this, employ your CRM, database of partners and other channels, also ask your biggest partners for their CRM fragments... External databases help a lot, like the Dan&Branstreet one. Once, I managed such a project, with 20 million client IDs requiring classification. 10 people made it within six months; it was intense.
Data is cleaned!
Having the clean data, we get the pure (3-column) list:
* Client ID, where the client is actually the centre of the purchase decision-making.
* Date, which could be the date of opportunity creation, the date of revenue recognition, or the date of product delivery. The choice is yours.
* Product category hierarchy. Also depends on the structure of your business, it can be a multi-level or a simple one.
Based on this list, we can easily build a series of nice statistics and visualisations. The chart below looks a bit messy, but let's read the description...
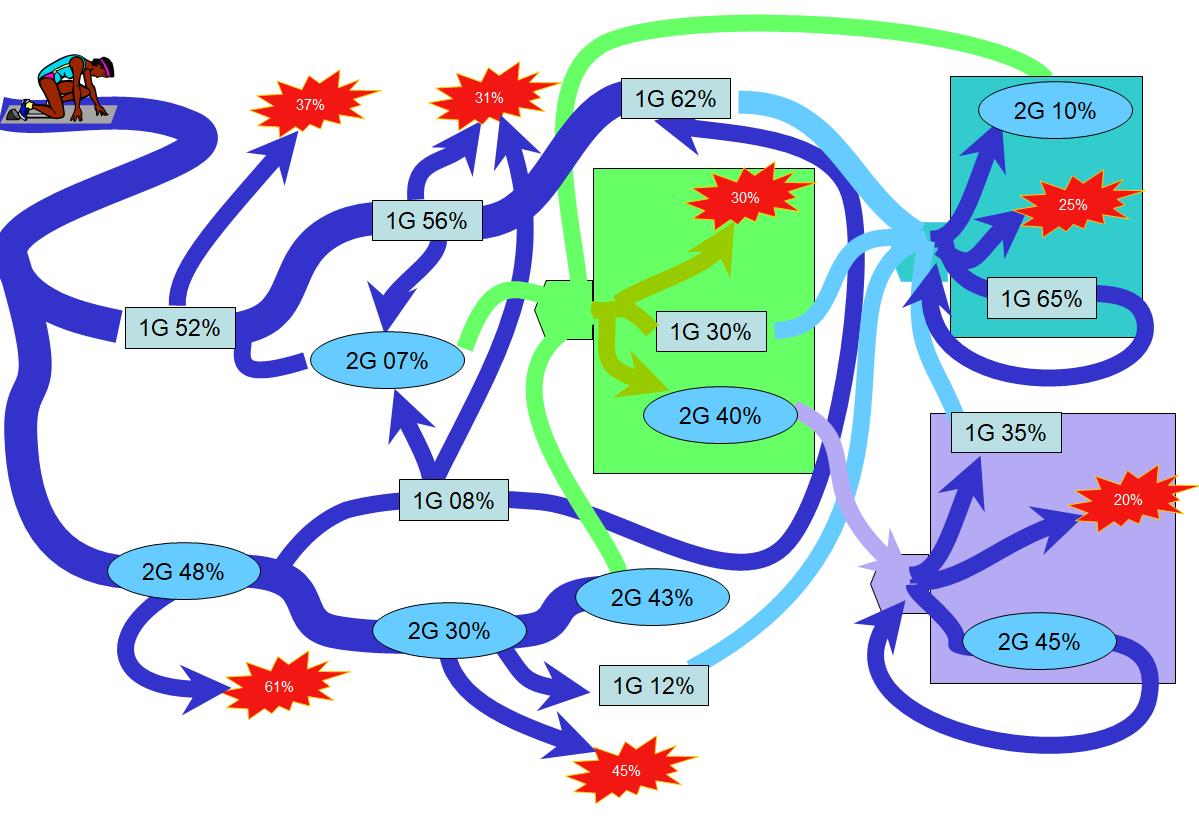
This chart depicts the business with two major business groups: 1G and 2G (shown with distinct colours and shapes). From the point of view of the top management of the company, these Groups are complementary. Let's check what happens with a client (based on figures instead of gut feeling).
A stranger (actually, some company, which was never our client before) buys a product from 1G and 2G in almost equal proportion: 52%/48%. Sounds good so far, business is balanced, and this is typically the figure reported to top management.
But what happens next? The client does not become a repeat purchaser: 37% of 1G buyers escape the path, seemingly going to competitors, while for 2G, this figure is almost twice as high: 61% dissatisfied!
Furthermore, the idea of complementary products also falls apart: After 1G, only 7-8% buy 2G and vice versa! After this second purchase, many become dissatisfied. This reality is also depicted in the green central rectangle: it's a kind of path loop, where 30% churn in every cycle.
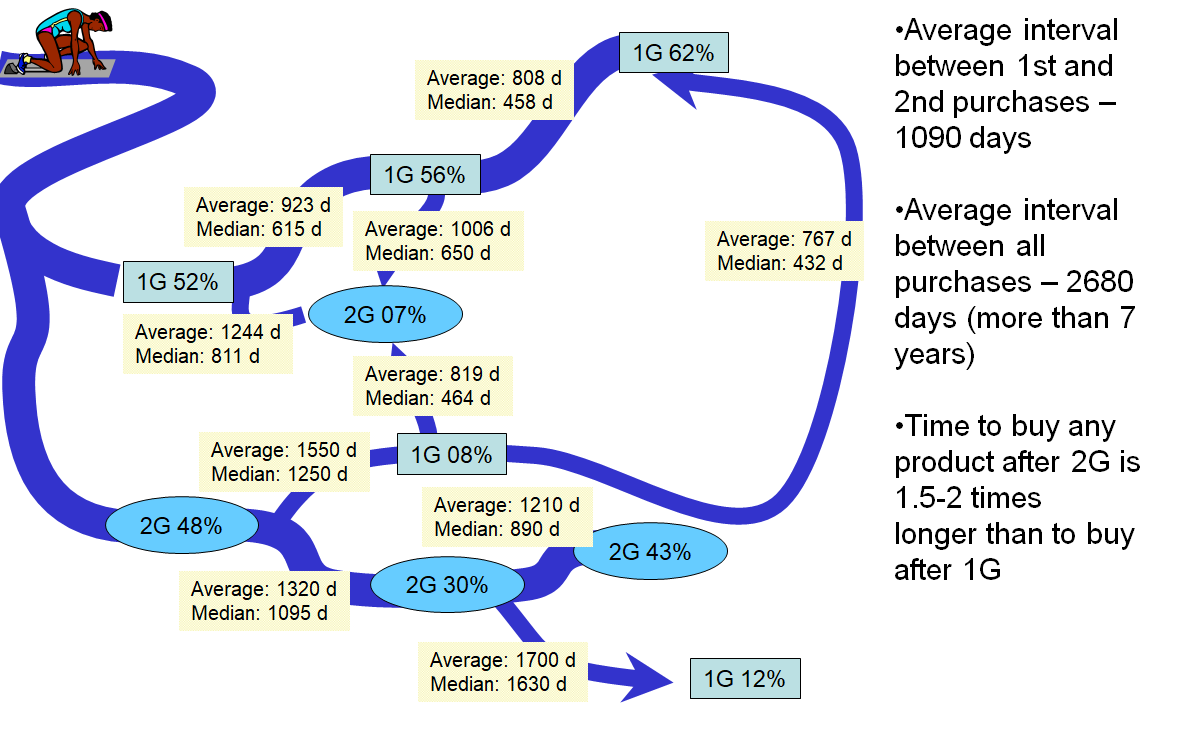
We are talking about sequential purchases; now, let's look at the time lags. The slide below demonstrates this well, with average statistics on the right side.
We can build detailed analytics with deeper granularity to better understand the drivers for cross-sell and which products are leading to client dissatisfaction. Ultimately, this detailed analysis allows us to draw important strategic conclusions.
Cross-department collaboration is key. This simple analysis can drive important decisions if management is ready for this truth.