B2B: sales offers optimisation
Today, we are talking about a company that operates in the B2B market. It sells the heavy equipment, and every sales action is quite a long process (from opportunity identification to revenue recognition).
For a Finance Controller or a Finance Manager, there are actually two important questions for analysts:

How well we perform now in terms of margin, and what actions should be undertaken in the future to improve the situation.
While the first question looks simple, it does not have a simple answer for everyday monitoring. This analytics is usually available at the end of the year, when almost all opportunities are closed or shifted to the next FY. However, for course correction, the management needs to monitor the situation weekly!
Before we continue reviewing this case, I would like to remind you of this evergreen slide:

Descriptive and Diagnostic parts of analytics are both widely used in Finance. These types of analytics basically describe the past. One must understand that it is not possible to progress without completing the previous step. Descriptive Analytics is fully based on correct and full data; Diagnostics is derived through a detailed review of Descriptive Analytics; Predictive models are based on a detailed formalisation of the Diagnostics model; and finally, the Machine can Prescribe something based on Descriptive & Diagnostic Analytical metrics and Predictive models.
Descriptive Analytics perspective: Where are we now?
The major requirements for the dashboards / reports at this stage are:
- Business needs in one source of truth: Source data is fully accessible; At the same time, data must be secured, and access levels can vary; All figures are precise (at the level provided by databases).
- Business needs a handy tool: All analytical insights are in one place; All data flows to the tool automatically, without manual interventions; All values are actual and fresh; All data is cleaned on the loading stage according to business rules.
Diagnostic Analytics perspective: Why are we here?
Usually, the developer of the dashboard system is involved at this stage, because the data model can be too complex for a simplistic Excel spreadsheet. At this stage, a Financial Analyst should have all the options:
- Anomaly detection: Various criteria; Autodection; Ability to identify root causes for every anomaly
- Breakdowns: deep dive into all possible business details, like, to the level of order/ opportunity/ sales manager (KAM)
Predictive perspective: What will we get by the end of the year?
At this stage, the Data Scientist comes to the scene. Together with the dashboard developer and the Data Engineer, he programs the so-called ETL pipeline. Then, together with the Financial Analyst and Financial Management, they define what metrics the company wants to predict. Or, what questions should be answered. In the sense of the use case we are talking about, it can be:
- What sales will be achieved by 31 December? or
- What revenue will be recognised by the end of each month, 12 months ahead? or
- What will be our monthly Integral Gross Margin (IGM), 12 months in the future?
Different questions - different models.
Prescriptive perspective: What and how should be changed?
This stage requires a precise understanding of what exactly we want to maximise or minimise. Is that IGM or revenue? Or do we simply want to make our sellers happy? Then, another important topic to consider: what are the manageable parameters? We can't change inflation, labour cost or the time required for the client to make a decision. Thus, we must define the parameters of the sales process that we can steer. Then, the Data Scientist makes the optimisation engine where the selected parameters participate and finds the optimal combination or combinations of them.
This optimum is the actionable insight, because all the parameters are under the management control, and the right decisions can be made.
What we model
If we look at opportunity-order-sale process a little deeper, we can notice that it consists of various steps:
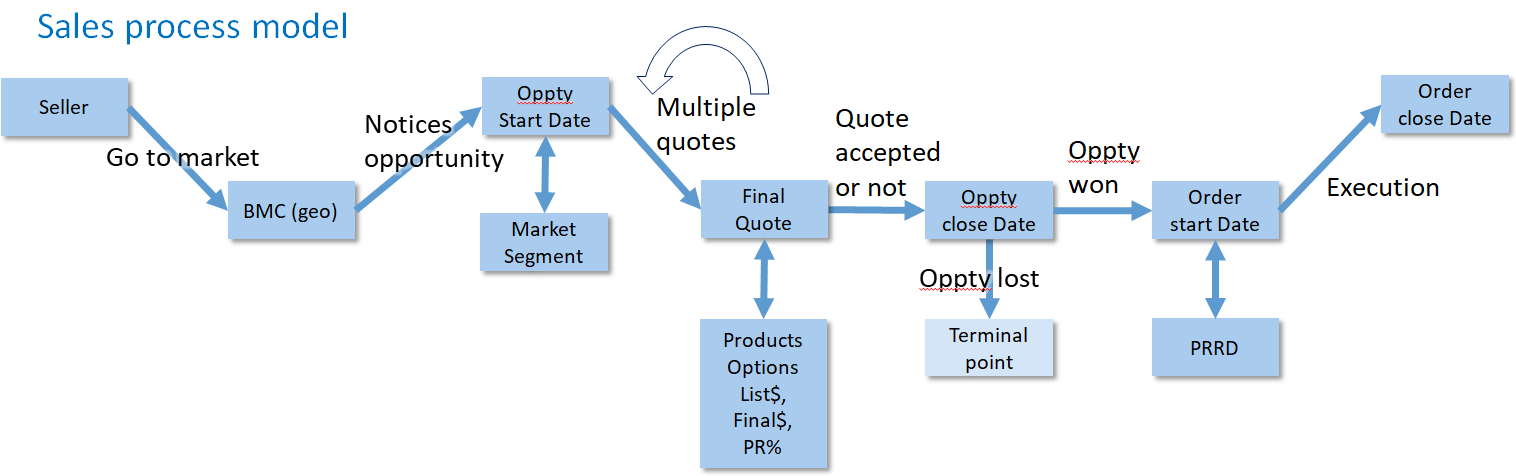
In time perspective, we are always somewhere between start and end of multiple processes:
The process is actually taking time. On January 1st, we have no recognised sales. Instead, we have only projected dates of sales, opportunities at the early stages and even not-yet-opened opportunities, which all have an impact till the end of FY.
In general, the process itself is complex for mathematical modelling. There are lagging, loopbacks, skipped phases and multiple parameters for every stage.
However, it is possible to avoid the complex math because we do not want to know how the process works. We want to know some basic outcomes in various circumstances. For this project, we made a decision to apply the Monte-Carlo simulation method to generate the sales process in various circumstances.
Dashboard
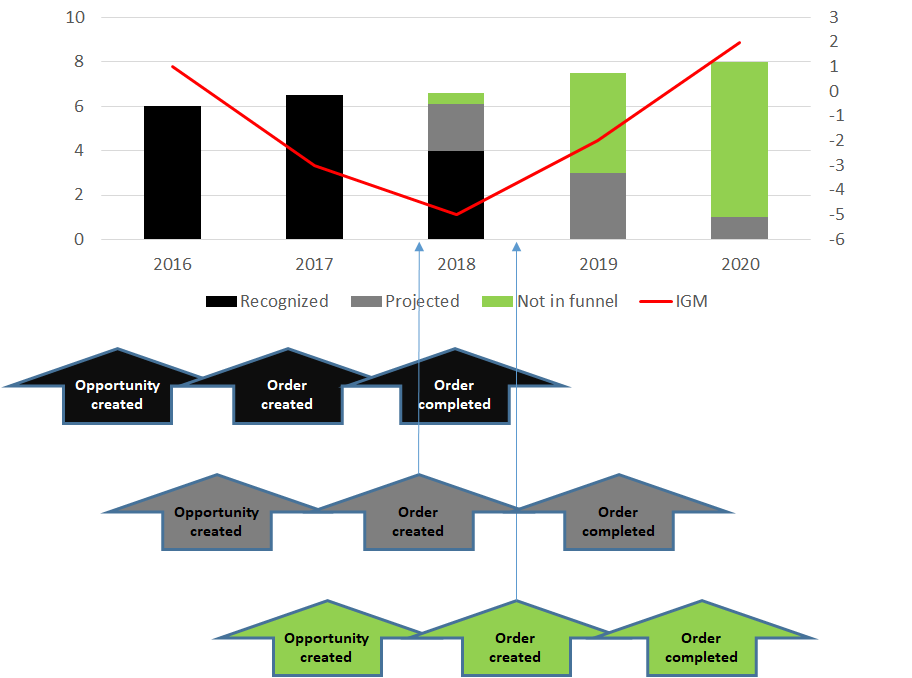
The dashboard extends the descriptive elements with predicted values. For example, this visual shows both actual and simulated (predicted) opportunities.

The visual below shows the Sales volume, which has already been recognised in 2017 and 2018. It also has some value projected / booked in the system, as there are some orders in the pipeline with not recognised revenue yet - in 2018 and 2019. Next years, 2019 and 2020, include also forecasted sales volume (in green).

For diagnostic purposes, this picture can be expanded to provide a detailed view, by month. It can also be filtered to narrow down to the level of particular products, countries and markets.

Predictive part of the dashboard
As it was said, every KPI in the dashboard have the predicted value in addition to actual values. This forecast is performed under the assumption that no sales parameters are changed. Both manageable and non-manageable parameters are assumed to be stable in the coming year(s). However, depending on the ML model, we are able to tune parameters. This approach is named scenarios. We are able to adjust any of the four parameters included in the model, or all of them together, to simulate the future conditions at the market. We then generate the new future vision. Look at this picture below.
We are able to change the target price (the price uplift built into the contract), the configuration of equipment to be offered to clients, the product mix, and, finally, the set of clients where we will sell our products (market segment). In every case, that doesn't mean that we will sell only this device to this exact market, no. We can just a bit tune the proportions.

Upon parameter update, the analyst runs the simulation. One future is simulated relatively fast; if the analyst prefers higher precision, the system can also run an ensemble of models and then average over the results obtained.
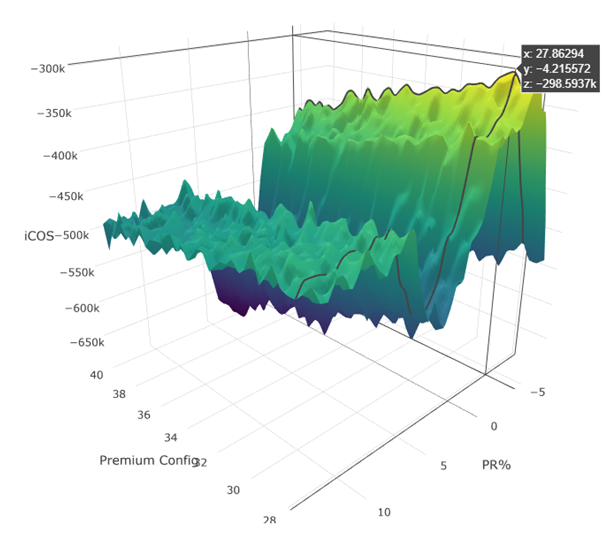
Prescriptive outcome
It is not only a tool for answering "what if we change", but also a recommendation tool: the AI actually shows you the optimal combination for the chosen 4 parameters by executing millions of scenarios in various settings. As a result, we obtain a 5-dimensional surface, which, of course, we are unable to view. But we can get the cross-section. The picture below demonstrates ICOS optimisation in the two-dimensional space of changed Configuration and Price Realisation.
We obtain the maximum in the case of the reduction of the Premium Configuration offering down to 28% and a price reduction by 4.2%.
The company driven by AI
This is the real use case when AI drives the decisions. It is not Descriptive or Diagnostic Analytics when decisions are made by human based on past data and their imagination of the future trends. This is not the ML-driven company, where human managers make a decision based on various projections of the future while the Machine crunches the enormous volumes of data.
Instead, the properly settled Machine set the only possible combination of manageable business parameters for the top-most IGM.