B2C product Life Cycle
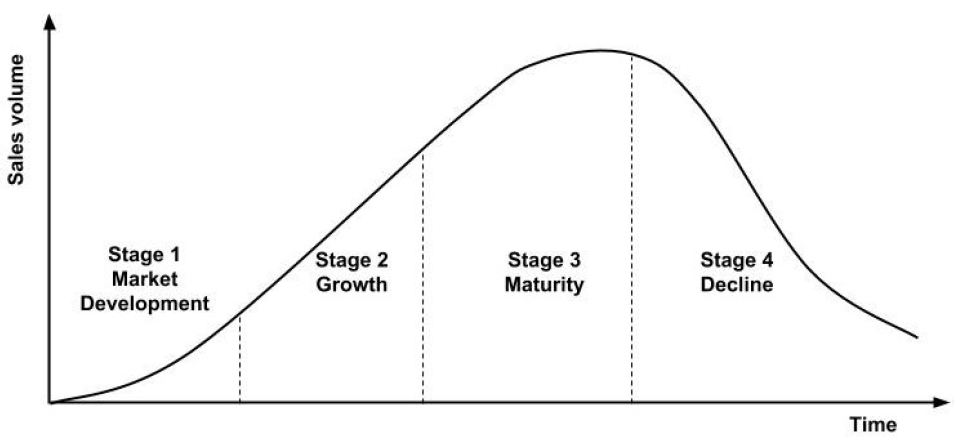
Every company knows that products have a limited life cycle. Right after invention and start of the manufacturing, the sales of of the product goes up. However, due to various circumstances products die and dissolve from the market. The generic life cycle is presented at the picture below.


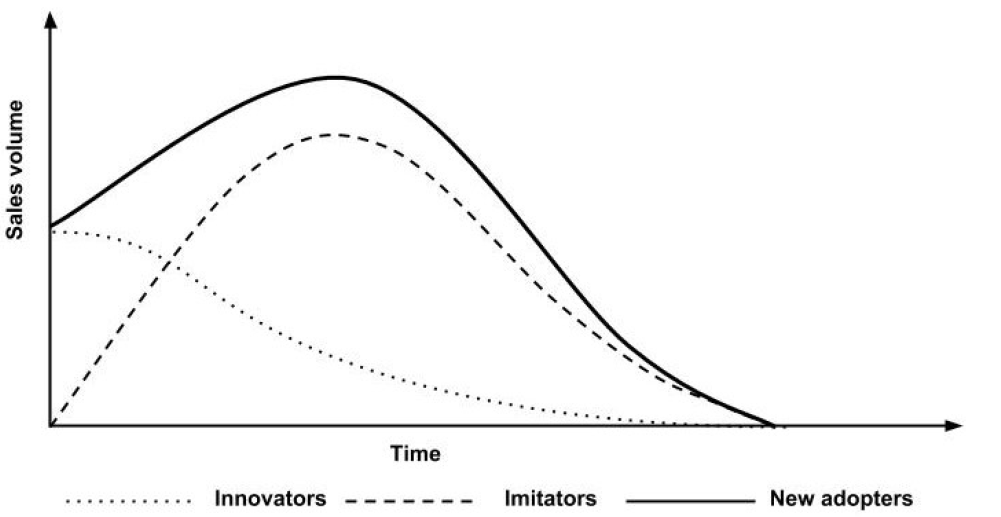
- USA consumers demonstrate clear behaviour of "new adopters",
- Chinese consumers tend to act as "imitators".
Based on these finding, the supply and marketing program should be adopted for both markets to achieve higher effectiveness.
Having the generalised curve for product/market, we can control the situation for new products: are they performing well compared to standard view, should we invest more in the channel, or reduce presence on the market.
