B2C: SKU optimisation
Let's imagine that our company operates in a highly competitive B2C market. Suppose we sell electronic devices to consumers worldwide. There are 4-5 major competitors in the segment, and we aim to cover as many product variations (models) as possible. Consequently, we compete directly with all five companies. Currently, we sell 30 models, and it is difficult to manage such a number from the standpoint of inventory, marketing budgets, warranty provisioning, etc. We are not sure, but...
- Perhaps some models cannibalise others.
- Perhaps we don't fully cover the available market space.
- Perhaps we're losing ground to competitors, but it's unclear, as our market share has been close to 25% for years.
- Perhaps we invest too much in developing new features that bring little value to end users.
- Perhaps we overlooked some features that are in demand.
We (as always) want to reduce costs while preserving revenue and profit. The most straightforward path seems to be killing some of the variants, but which of them? Strategically, we also want to re-position some models to achieve higher profitability, but how?
Background
The focus of this ad-hoc research is on the problem of optimisation of SKU assortment in order to maximise the margin of the full category.
We began by translating generic business questions into a more technical form suitable for a data science study, starting from the strategic level and moving toward analytical detail:
- Which models can be excluded from the portfolio with a positive (or non-negative) impact on total category IGM (Integral Gross Margin)?
- Where will consumers switch if a model disappears from the market? How do they choose the nearby alternative?
- Since distances between products in the decision-making feature space are crucial, how can we estimate these distances?
- Are there differences between countries?
- Which statistical methods are most appropriate for this analysis?
- Conclusions are based on the collected total attribute matrix and market share data. What are the sources? How to collect data about market and consumer preferences without a formal market research survey?
Our hypothesis on consumer behaviour
It’s important to note that the consumer electronics market has a specific characteristic: purchase decisions are rarely spontaneous. Consumers typically research and compare options before buying, grounding their choices in practicality and perceived value. How do consumers choose and react to various competing alternatives?
- After gathering information, they evaluate alternatives [3rd step of customer journey], basing their decisions on product attributes such as brand, colour, size, or specific features.
- … and we want to understand the utility (relative importance) that consumers expect to obtain from these attributes (or, in mathematical terms, the weights of variables).
- Once these utility values are determined, all products can be mapped in a multidimensional attribute space, where the distances between products represent how consumers perceive similarity or substitution potential.
Data collection
Two decades ago, a manufacturer would typically engage a market research agency to conduct a comprehensive market research survey. Today, modern digital technologymakes it possible to achieve the same without surveying consumers. In principle, all the necessary data is already available.
- There are regular and detailed reports on retail sales. These reports available from major agencies (GfK, NielsenIQ, etc.) include global coverage of all consumer product sales (counts) together with average sales price (ASP), i.e. how much consumers pay.
- All product features can be obtained via web scraping from leading e-commerce platforms. They include model codes and attribute vectors.
- Integral Gross Margin is important for "our" products only, and thus can be obtained from internal financial systems.
The first two datasets enable us to simulate the conjoint analysis study. In this study, instead of asking 5000 potential clients to rank hypothetical cards with a limited set of features, we leverage real-world market behaviour from real consumers who already voted with their wallets. Yes, they didn't rank cards; instead, they have chosen the first best (for them) product from the real marketplace. And, there were millions of consumers.
Although these consumers didn’t explicitly rank options, they effectively made utility-maximising choices. Each buyer evaluated the available products, considered the full set of features, and selected the one that best met their preferences and budget. As illustrated in the example below, a typical online product listing provides access to a vector of approximately 100 attributes offering a rich and realistic basis for understanding how consumers perceive and prioritise product features.

Analytical Method
The analytical approach we use is conjoint analysis. At its core, conjoint analysis is a multinomial regression model designed to extract the relative importance of product attributes - that is, how strongly each attribute influences consumer choice.
The chart below is just an example available on a web (here). It illustrates the positioning of "our" products and competitors' ones in the given space of product attributes.
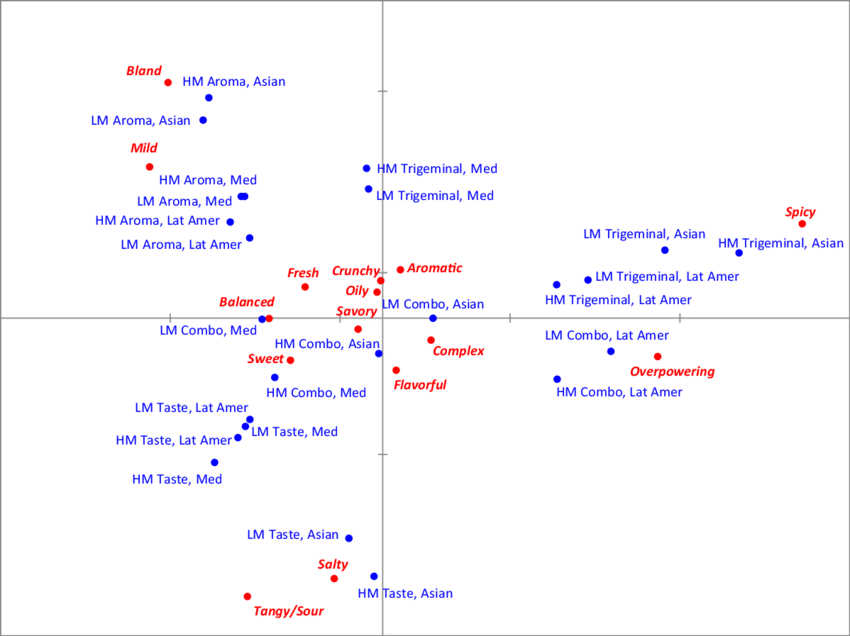
Of course, we can't observe the full 100-dimensional attribute space. However, we can apply the correspondence analysis to choose the major principal components of this universe. This dimensionality reduction allows us to identify and interpret key market patterns. Note, this positioning is valid only for the initially given set of attributes.
Based on this map, it is easy to understand several important insights:
- Overcrowded areas: Regions densely populated with our own models indicate internal cannibalisation. Too many similar options make the choice unnecessarily complex for consumers. These products are primary candidates for rationalisation or removal from the assortment.
- White spaces: Areas where competitors are present but our products are absent highlight unserved market segments. These zones represent potential opportunities for new product development or repositioning.
- Competitive proximity: When a competing model is positioned very close to one of ours, removing our low-margin variant may lead to immediate market share loss, as consumers would naturally switch to the nearby competitor.
While the map is a powerful strategic tool, we shouldn’t rely on it exclusively. It is well established that the two dominant principal components often correspond to price and brand. Exploring additional dimensions can uncover deeper insights. For example, identifying clusters of products differentiated by design features, performance, or user experience attributes.
Integral Gross Margin (IGM)
Before deciding which products to remove from the assortment, it is essential to estimate the impact on the overall Integral Gross Margin (IGM)of the entire category. This can be modelled quantitatively.
As shown in the chart below, certain products can be excluded while maintaining (or even improving) the total IGM. However, these results must always be interpreted in the context of the attribute map discussed earlier, taking into account competitive positioning and strategic priorities.
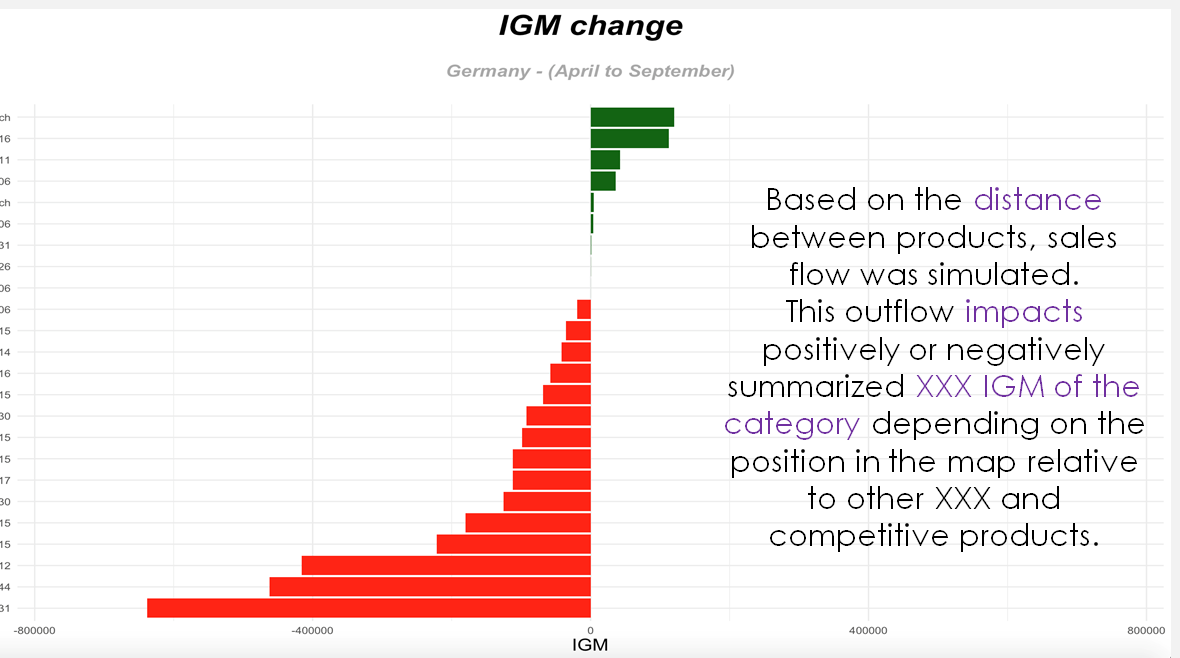
It is easy to notice, that some of the products can be excluded and overall impact will be positive. However, we have to remember the previous map and keep in mind competition and strategic plans.
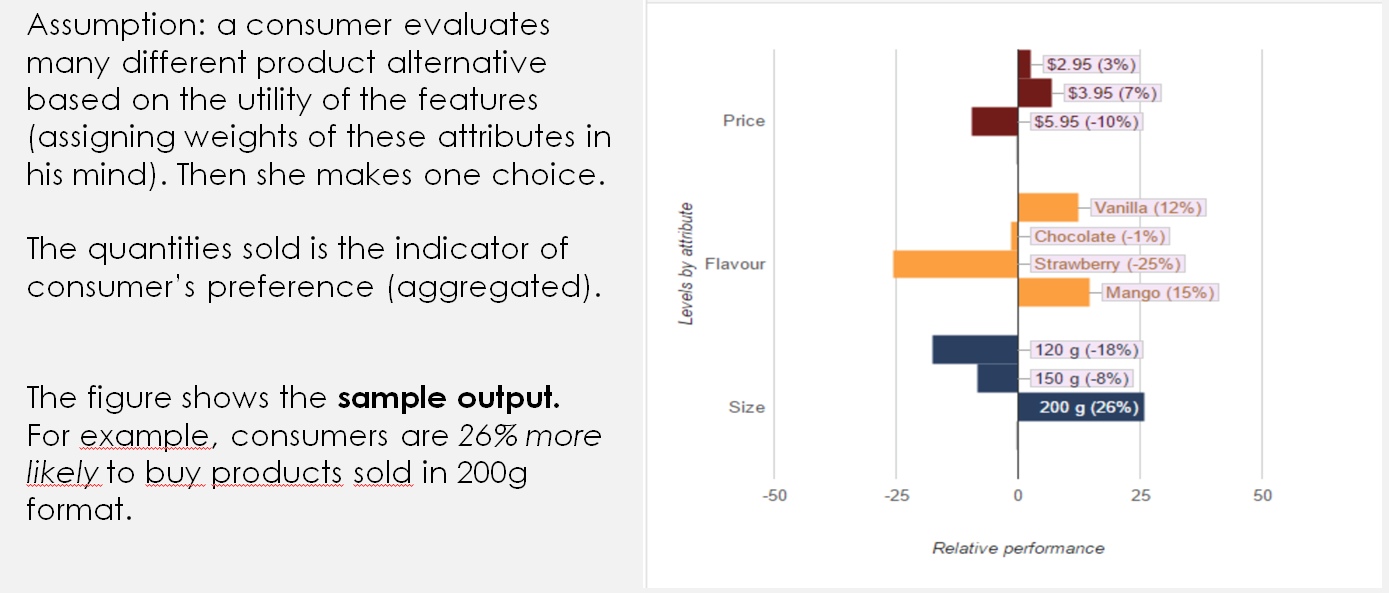
Importance (utility) of various features
One of the key outcomes of this project is the estimation of feature utilities, the relative importance of each product attribute for consumers in a specific market. The resulting utility values can be visualised in a chart such as the one below, highlighting which features most strongly influence consumer choice.
Implementing the findings enabled the company to directly improve overall IGM, while also achieving several indirect benefits: reduced spare-part inventory, modest cuts in marketing expenditures, and a more focused product development roadmap.
Given these results, the company decided to repeat this analysis annually to ensure ongoing alignment between product strategy, market dynamics, and profitability.
Future Outlook
Looking ahead, the tool can be further enhanced with simulation capabilities. For example, testing what-if scenarios such as adding or removing specific features from selected models.
However, it is important to recognise a limitation: this type of simulation remains valid only within the existing attribute universe. In other words, it cannot predict the impact of entirely new, disruptive innovations that introduce previously unseen attributes or technologies.